If you're a Salesforce developer, you probably know about SFDX commands. They're super helpful and are easily available in VS Code. Let me tell you about a few basic ones that I use a lot.
- Using Command Palette for SFDX commands
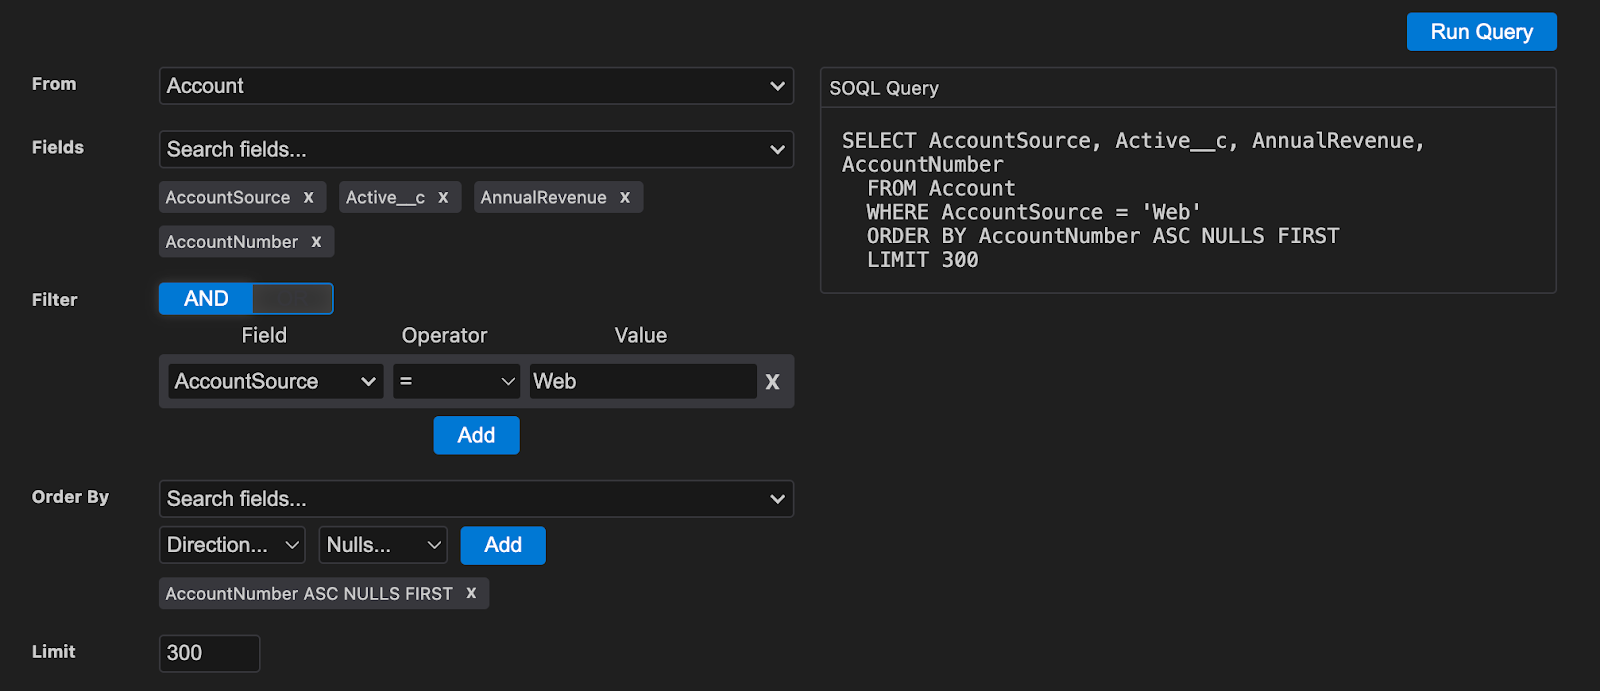
- Create query in SOQL Builder
- Execute SOQL Query with Currently Selected Text
- Execute Anonymous Apex with Currently Selected Text
- Get Apex Debug Logs
- Run Apex Tests
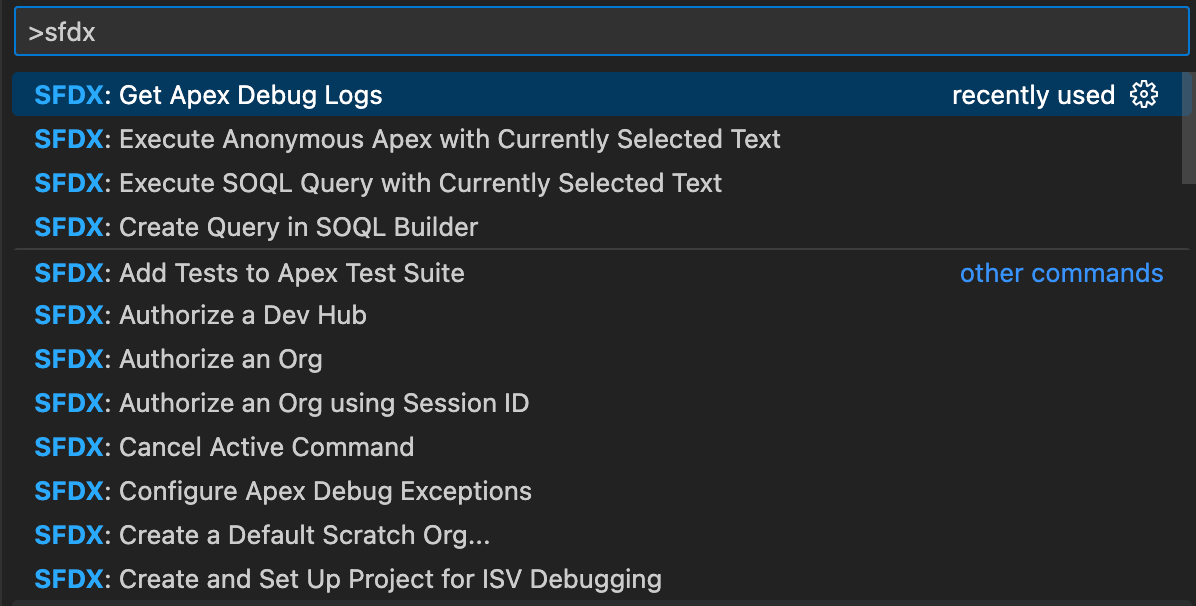
SFDX Command Palette
To see all the commands, press Command (or Ctrl) + Shift + P to open the command palette and type sfdx. You'll get a list of all the SFDX commands available.
Create query in SOQL Builder
You can build queries using SOQL Builder. It helps you add filter and order by functionalities.
You can see how your query will look before running it. Then, click Run Query to get your records.
Execute SOQL Query with Currently Selected Text
You don't need to go to the Developer Console to run queries anymore.
Use the Execute SOQL Query with Currently Selected Text command instead.
Below is an example of how you can use it.
Select your query you want to execute, for example, in the class below, highlight the code and open command palette using
Command (or Ctrl) + Shift + P
Search for the command
Execute SOQL Query with Currently Selected Textand click on itClick on
REST APIoption

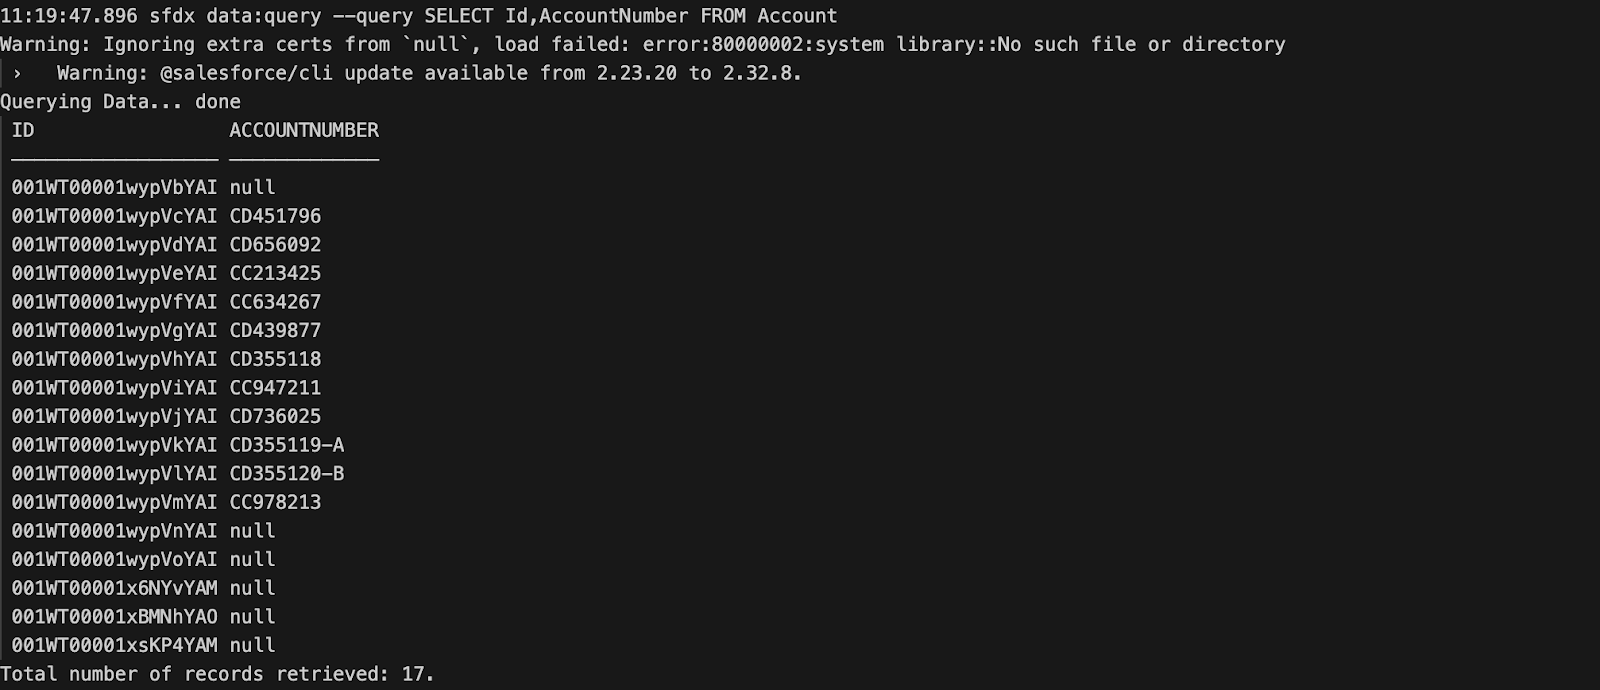
Here’s how the output looks like :
Execute Anonymous Apex with Currently Selected Text
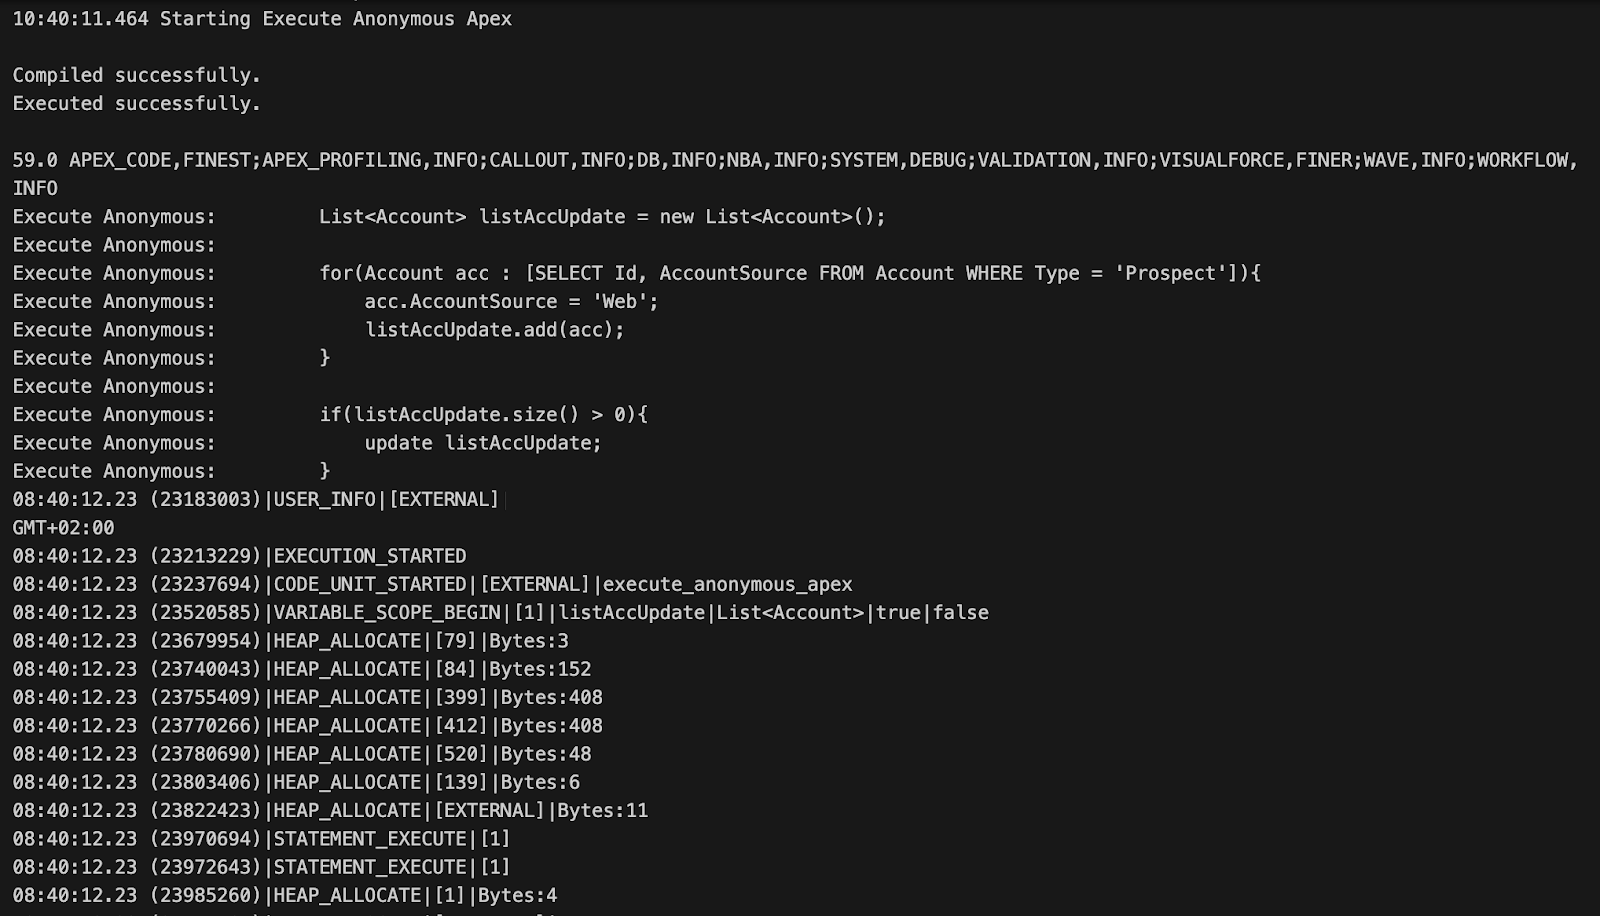
Earlier the only way to execute code was to use the option of Execute Anonymous in Developer Console. With SFDX, you can now use the command Execute Anonymous Apex with Currently Selected Text to execute any code that you want in VS Code.
Select the code that you want to execute, for example, in the class below, highlight the code and open command palette using
Command (or Ctrl) + Shift + P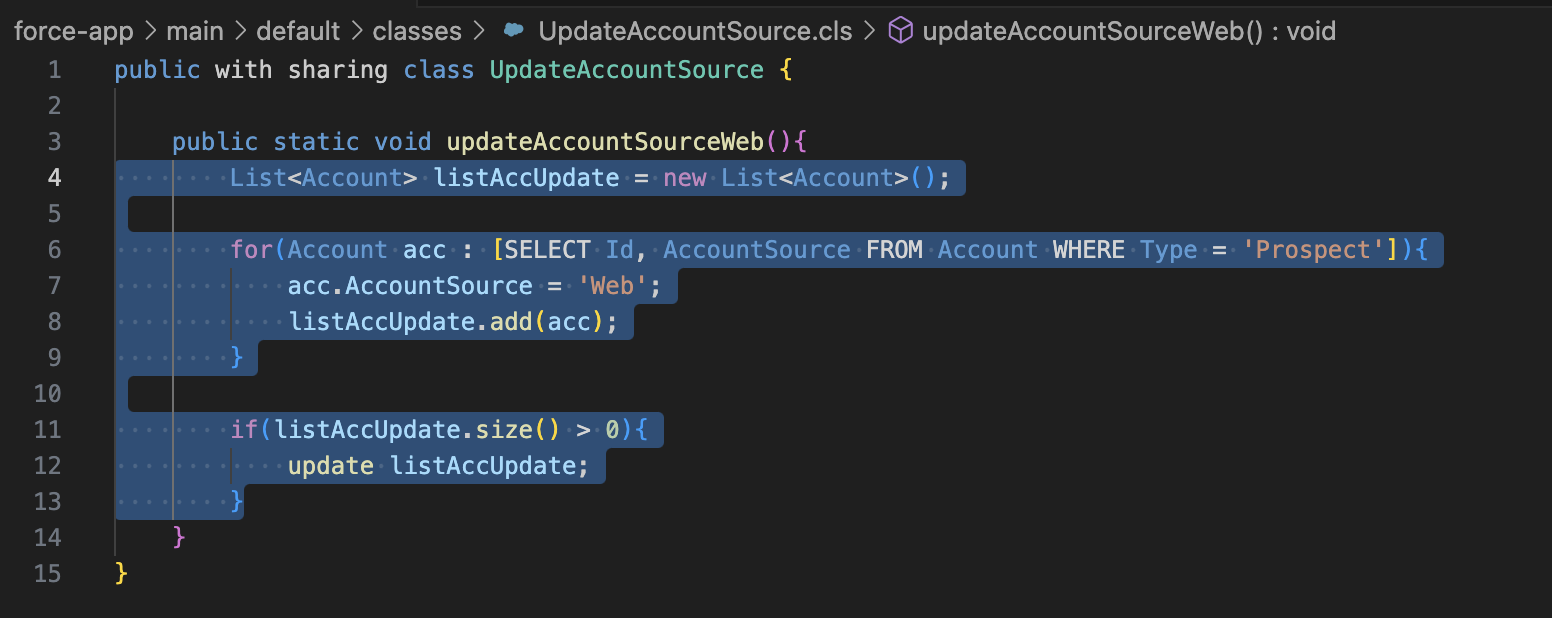
Search for the command
Execute Anonymous Apex with Currently Selected Textand click on it
Here’s the output and you can notice that it also shows you which part of the code you executed:
Get Apex Debug Logs
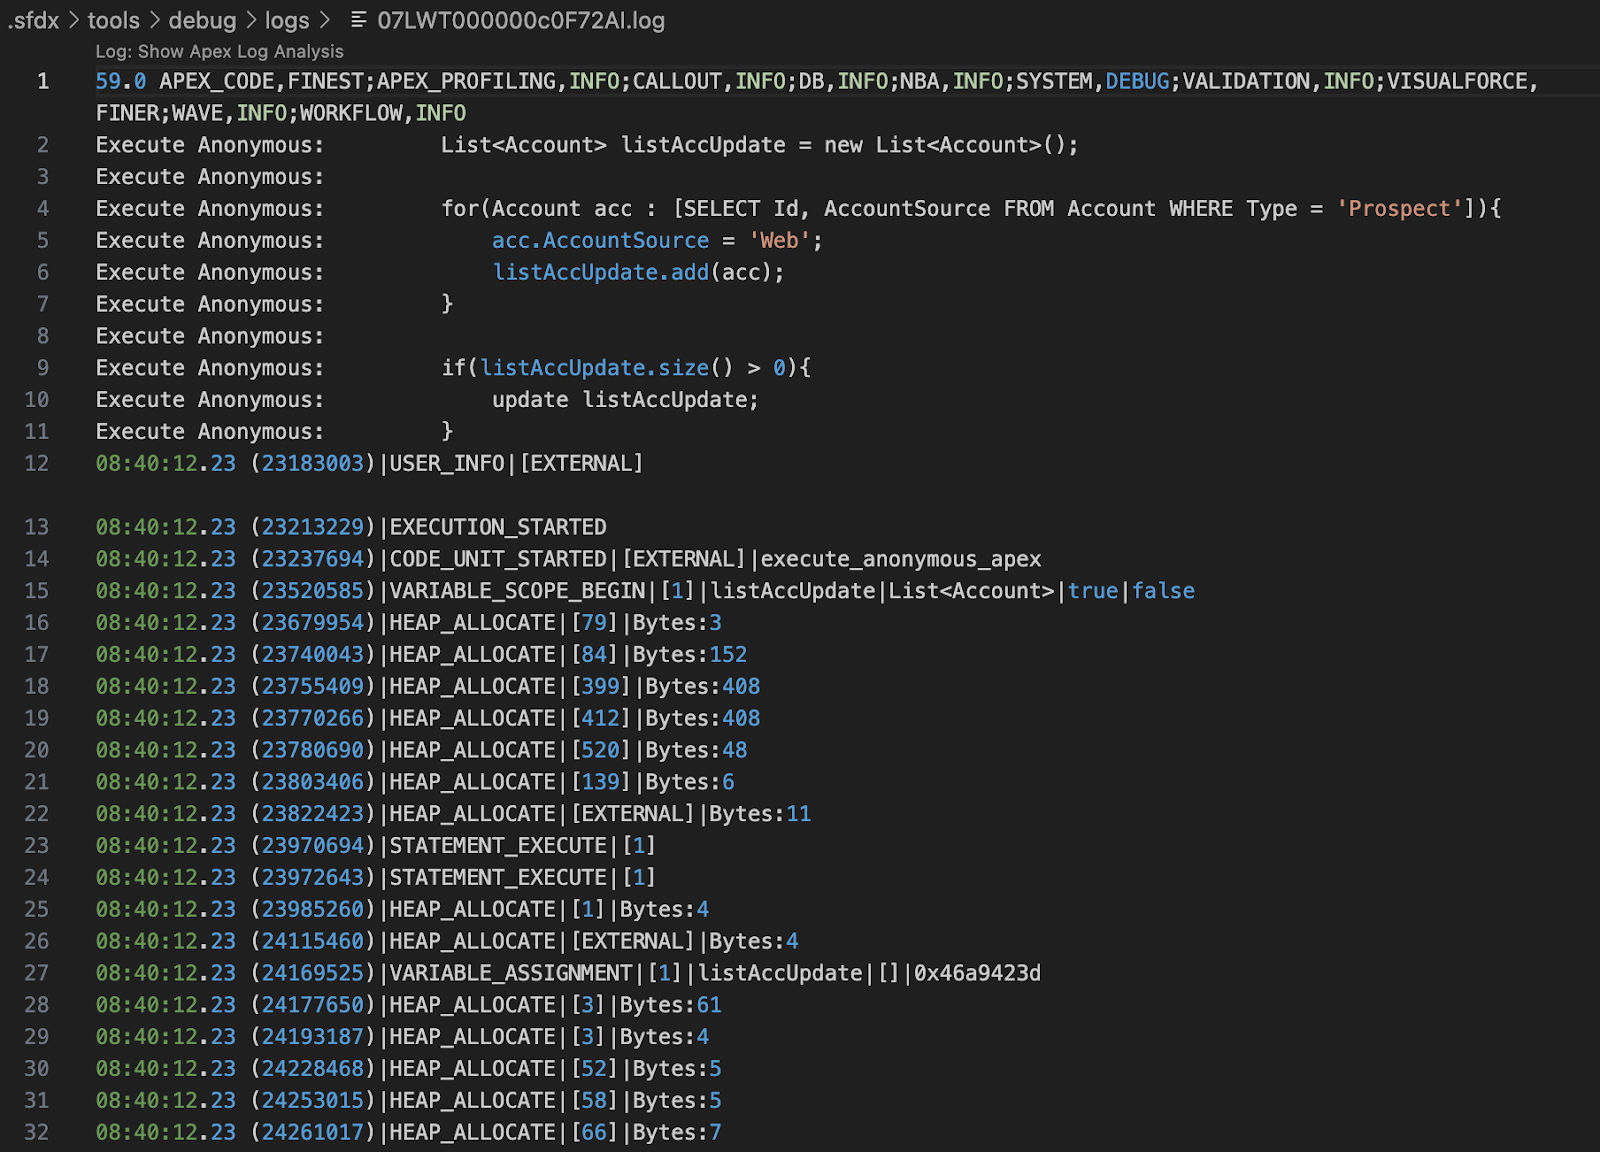
If you want to see what's happening in your code, use Get Apex Debug Logs. Make sure to turn on the flag in Setup first. It's just like looking at logs in Salesforce, but easier.
Search for the command in the command palette and click on the log that you want to see from the list.

Here's how the debug log appears in VS Code :
Run Apex Tests
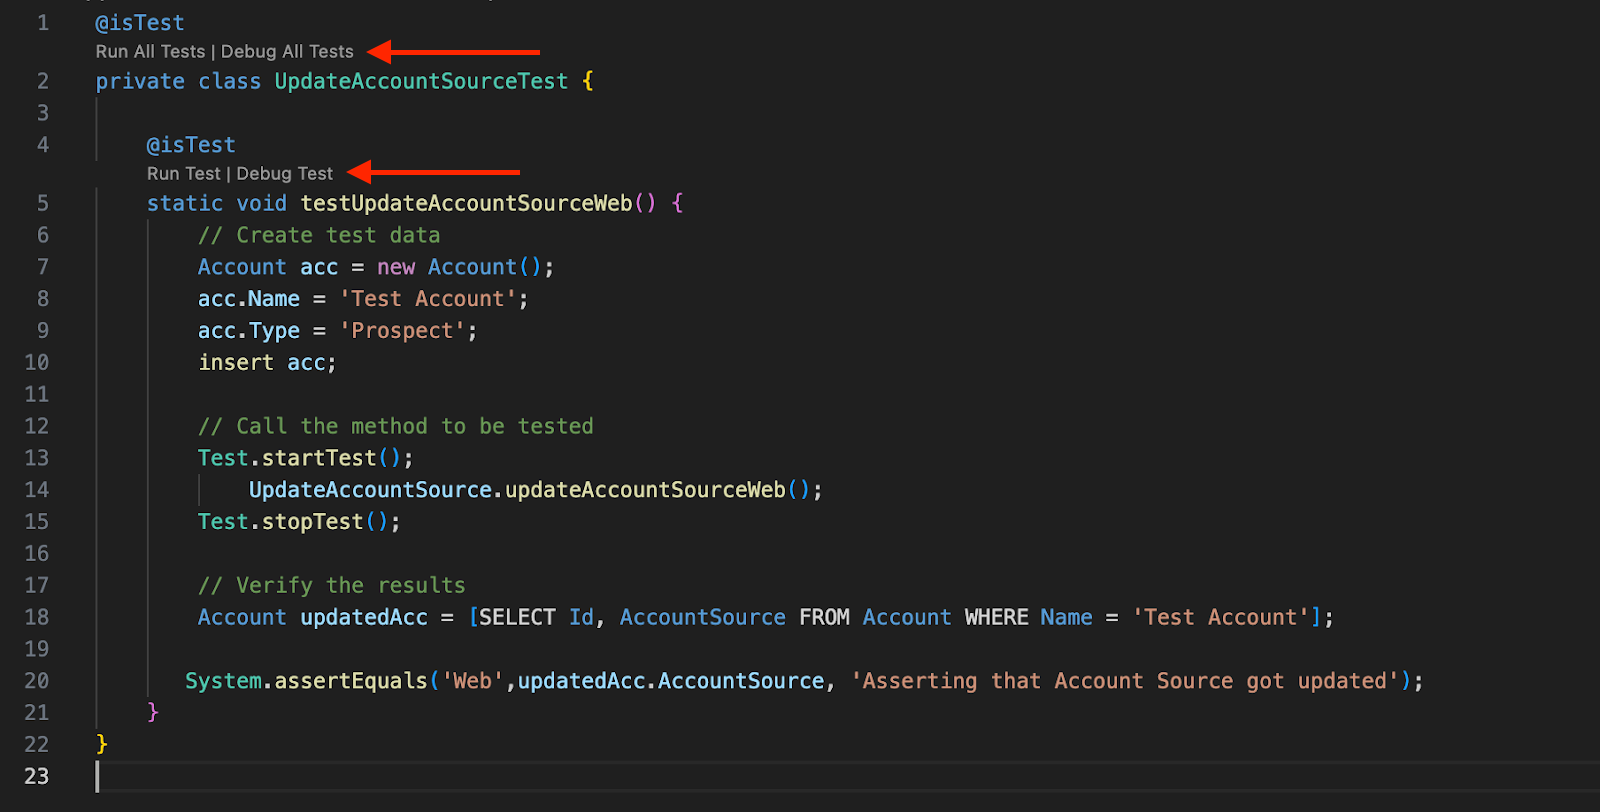
With Run Apex Tests, you can test all your code or just specific parts. Click Run All Tests or Run Test to see if everything's working fine.
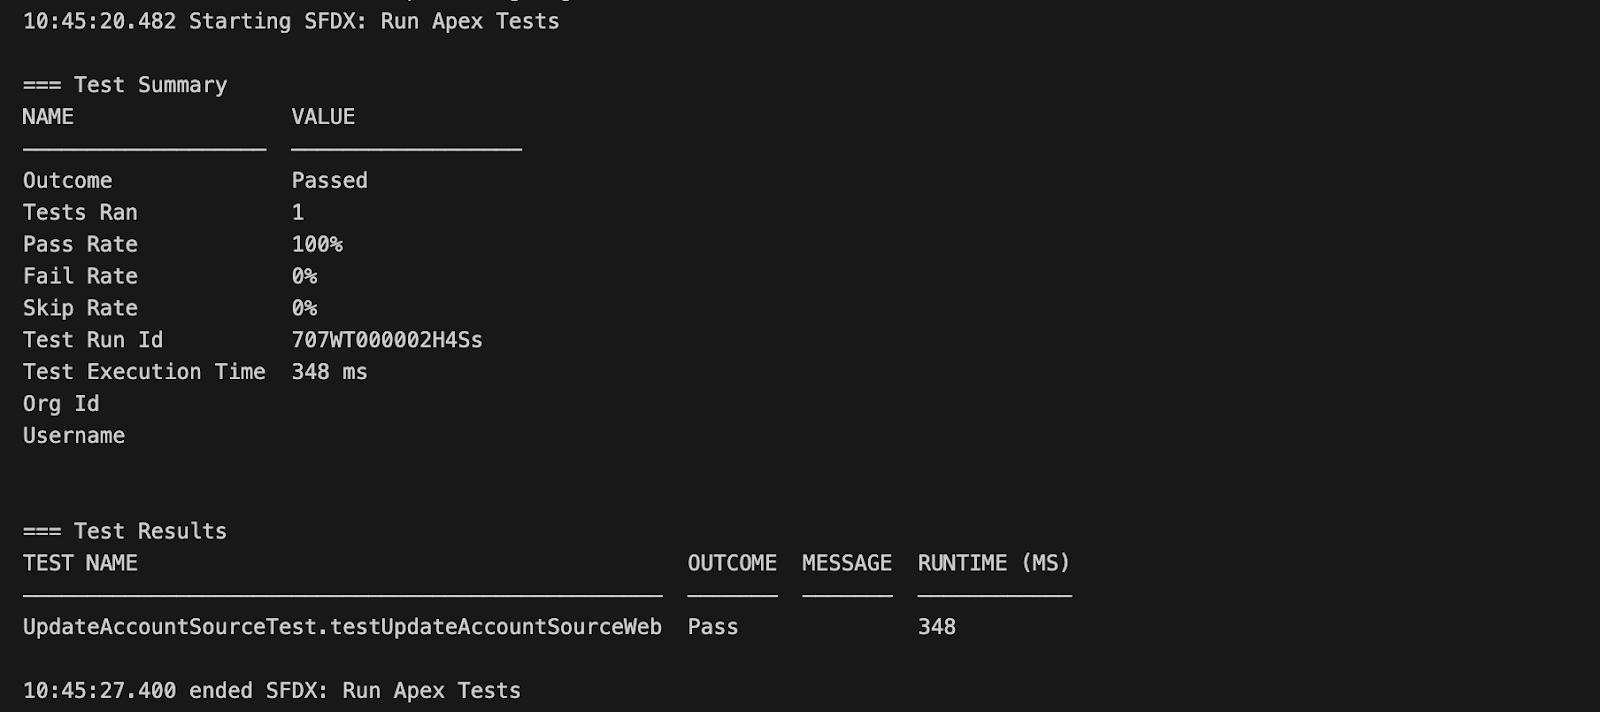
This is how it looks like after running the tests :
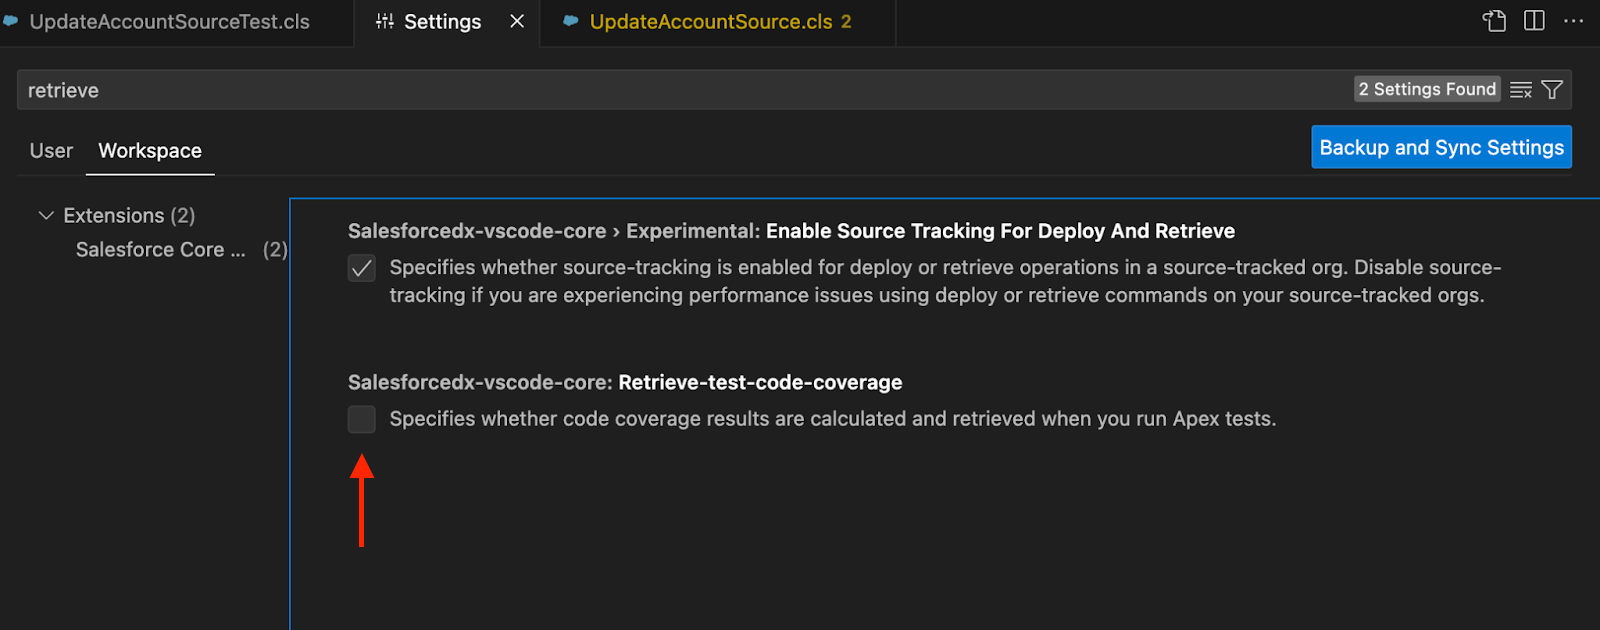
If you want to see the test coverage, then you need to edit your workspace settings. Go to File -> Settings, type in retrieve in the Workspace tab and check the option Retrieve-test-code-coverage
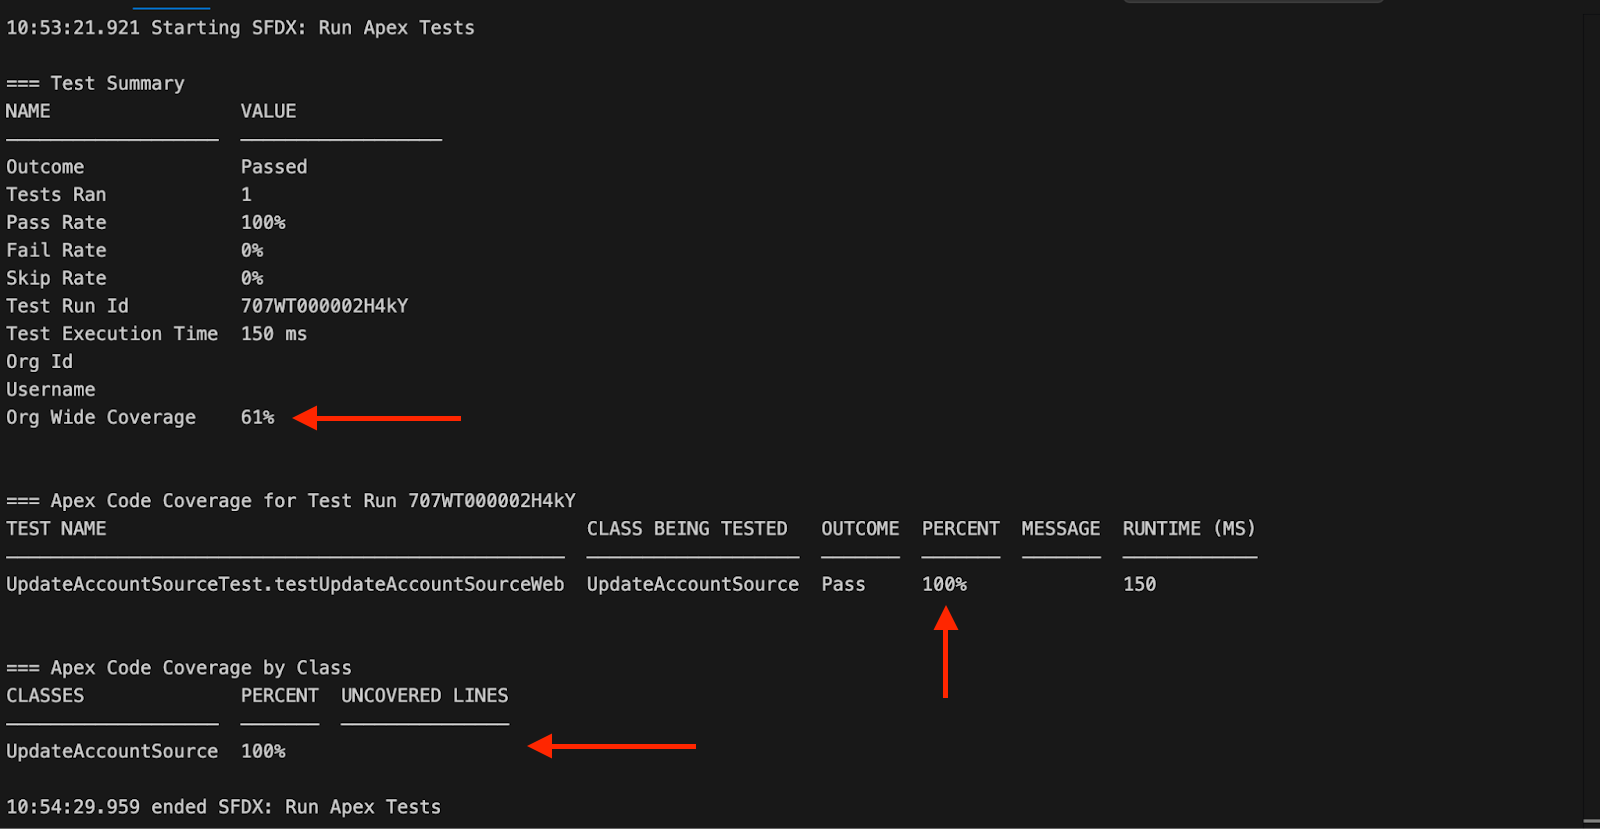
Now you can see your test coverage easily. You can also see the org wide coverage and the class coverage as well.
These simple commands can make your life as a Salesforce developer a whole lot easier. Give them a try and see for yourself!